# How M20 IB grades were calculated
With the coronavirus pandemic causing worldwide disruption, the IBO made the decision to:
- Cancel the May 2020 (M20) exams, and
- Calculate a grade using "an algorithm"
Since the results were released on 6 July 2020, there had been lively discussions between students, teachers, parents, and schools. Despite usually very thoughtful and generally considerate of what is a tough time for everyone, most of the discussion was philophical hang-wringing, because "the algorithm" remains unknown.
In the past week, DH and I have collaborated to reverse-engineer how the grades were calculated. The general model works broadly for all subjects, with weighing that is specific to a school / subject / level combination.
Caveats
DH wishes to maintain anonymity, but he contributed the majority of the data and most of the smarts. It's been awesome pinging ideas back and forth with him. Thank you DH.
I work with the IBO on various things, but I have no special insider knowledge about grade calculations. All my findings here are empirical.
This is my writing, and does not represent the IBO or LPCUWC, the school I teach at.
An earlier version of this article presented deduction of the model based only on my data, and contains interpretation that is now obsolete. For transparency, that version is archived here.
I want to do more illustrations and interactive explorations for this article, but they will take time and... may not be forth-coming.
# Terms
"Grade" and "marks" are usually used interchangeably, but in this article I am going to use them with specific meaning. Grade is used for a value between 1--7, that represents the gross achievement, whereas mark is an absolute value out of some arbitrary maxima, and accepts fine increments.
- IB grade. This is the number, out of 7 (maximum), that students receive as an indication of their achievement in a subject, as defined in grade descriptors. This is constructed from the scaled mark, using the grade boundaries.
- Grade descriptors. These are descriptions of what a student should be able to do / think, in order to deserve a particular grade. These are applicable to an entire subject group (e.g., sciences) An example: to earn a grade 7 in the sciences, a candidate should "display comprehensive subject kowledge and a thorough command of concepts and principles. Selects and applies relevant information, concepts, and principles in a wide variety of contexts. [...and it goes on and on!]"
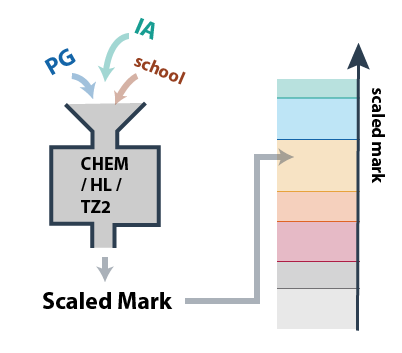
- Scaled mark. The scaled mark is a number, out of 100, that takes into account everything the IBO knows about a student. In a normal year this would be composed from exams and coursework. For each subject, the scaled mark is compared against the subject grade boundary, and used to generate the IB grade.
- Grade boundaries. Because exam papers vary in terms of difficulty, the same raw number reflects different achievement. In a normal year, after the exam session, the Grade Award Committee classifies a pile of (ungraded) papers into bins that they believe fulfill progressive grade descriptors. They argue about what papers fall in what bins, and then when that's settled, the papers are marked, and the numbers used to generate the grade boundaries that are specific for each paper. This initial boundary gets amended by polling the examiners (or only senior examiners?)
- Predicted Grades (PG). PG refers to many things, but in this article, PG is a number, out of 7, that teachers submit to the IBO around March 2020. It encapsulates everything that a teacher knows of a student, and thus would predict the a final grade to be. In a normal year, this PG is used as a protective mechanism, triggering automatic reviews of scripts if the IB grade is wildly off.
- IA mark. For the sciences, there is only one piece of coursework, and that is called the Internal Assessment (IA). It is marked with six criteria, and the maximal mark is 24. In a normal year it counts for 20% of the scaled mark.
- IA grade. This is the IA mark (out of 24) converted using the grade descriptors into a grade. In almost all context this is... useless, so I won't use this term.
# Summary
The M20 IB grades for ANY subject that has both coursework and exam component was calculated in the two steps.
Subjects for which this does not apply
To spell out the obvious, this would not apply to EE, ToK, or Group 6 subjects for which it is entirely externally assessed.
It would also not apply to Further Maths, which is 100% externally assessed with no coursework.
# Step 1: Calculate Scaled Mark
The first step is the computation of the Scaled Mark. This was done using a combination of
- PG assigned by the teacher
- Coursework grades by the external examiners,
- context of the school, which may include the following data from the past
- averaged Scaled Marks
- averaged PG
- averaged IA mark
Specifically, the Scaled Mark is calculated as

Coefficients X and Y are weighing factors, determining how much that component ought to contribute to the Scaled Mark. These are constant for all students taking a subject at the same level in the same timezone.
Z is a constant for all students in the same school.
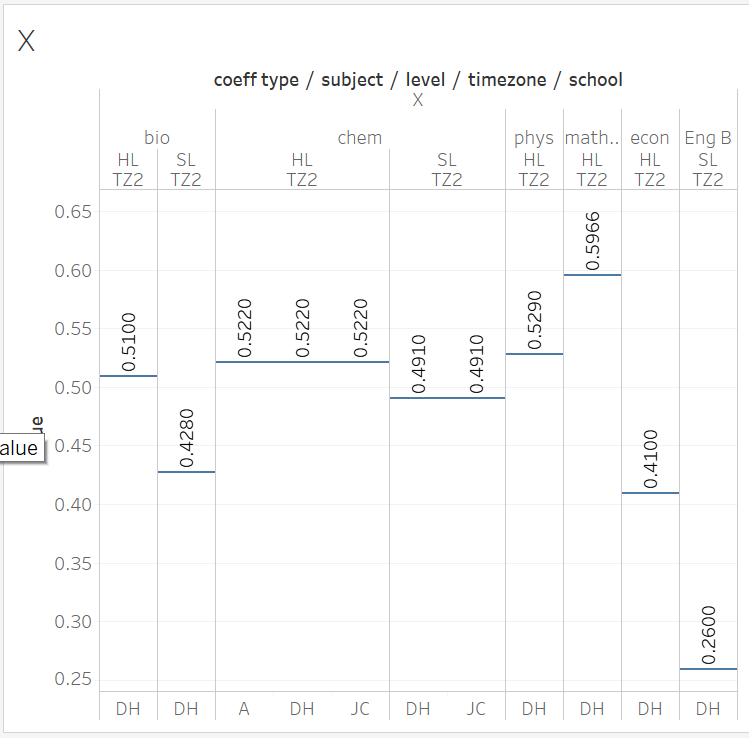
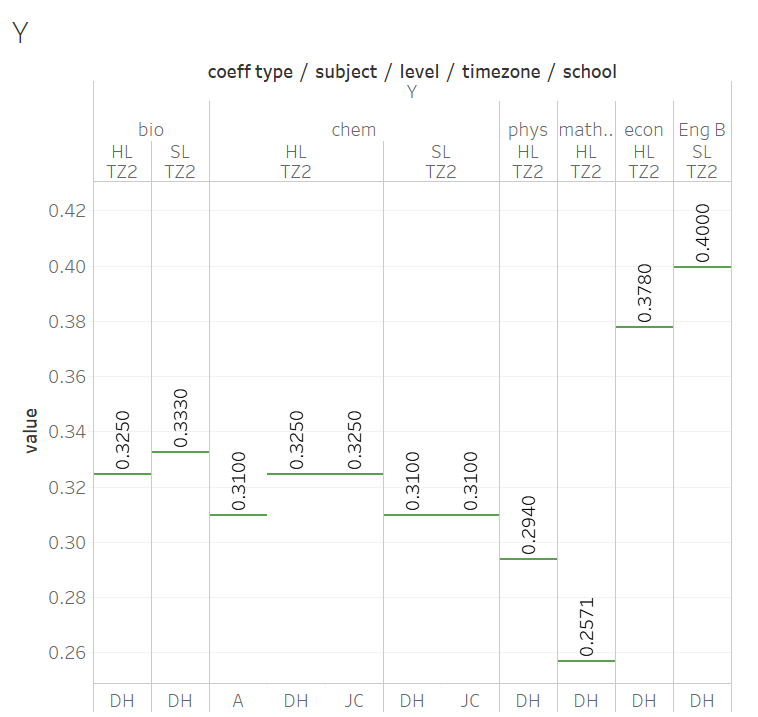
Values of X and Y can be seen in the following charts.
PG% is the Predicted Grade assigned by the teacher, converted to a percentage (i.e., PG/7 x 100%)
IA% is the (combined) IA mark as assessed by the external examiner, converted to a percentage (e.g., in chemistry this is IA/24 x 100%).
# Step 2: Convert from Mark to IB Grade
Once the Scaled Mark is obtained, it is then converted using subject-specific grade boundaries into an IB Grade. These grade boundaries are accessible by school DP coordinators, and a crowd-sourced version is available here.
The grade boundaries can be very different, and this means that the same Scaled Mark can result in different IB grades. As an example, a Scaled Mark of 61% in Chem/HL/TZ2 is a "4" (barely passing), but in Phys/SL/TZ1 is a "7" (excellent).
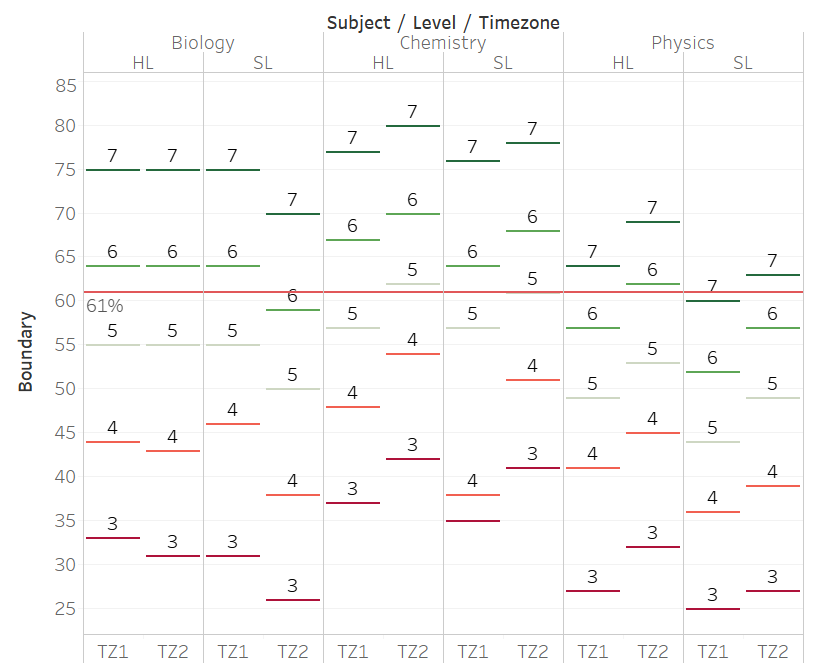
These grade boundaries are similar, but not identical, to M19 grade boundaries.
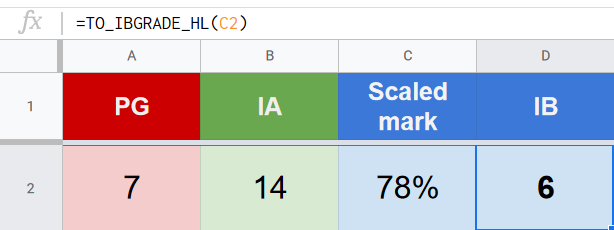
# A specific example
For chemistry, there is only one IA component, so the reverse engineering is easy to understand. My cohort of Chem HL students can be perfectly modelled using
Scaled Mark = (0.522 x PG%) + (0.325 x IA%) + 7.2%
If Sisi was assigned a PG of 5, and had an IA score of 12 / 24, her Scaled Mark would be calculated as:
SM = (0.522 x 0.71) + (0.325 x 0.5) + 0.072
= 0.61 = 61%
Converting with the grade boundaries would give her a "4".
To help advise re-marks, I've built a calculator for my students (and you!) to play with the possible outcomes here. You may want to play with this to get an intuition for how this behaves as well.
Should I re-mark?
"I am a chem student disappointed with my grade. Should I ask for a re-mark?" There are three factors to consider: the likelihood of success, the practical impact on your future, and principle.
Likelihood of success. If you are not my student, the specific numbers won't apply to you, but your IA is probably still 32% of your Scaled Mark. Speak with your teacher, and see what your IA is likely to get as a max, then see if that is going to change your Scaled Mark.
- For example, if your IA is currently 11, and your teacher thinks that it deserves 20, then there is a possibility that your scaled mark can go up by [(20-11)/24]x32% = 12%. A 12% increase brings your scaled mark across a grade boundary, so it is meaningful to give it a try.
- On the other hand, if your IA is currently 17, and your teacher thinks it deserves 20, then your max increase would be 4%. If you are 5% away from a grade boundary, then even if your IA gets maximally marked up, it would still not change your IB grade. In this case it is not worthwhile to appeal.
Practicality. If you are short of a university offer because of the chem grade, and you have a good likelihood of success, I'd say yes, go for it.
Principle. Another word for this is... pride. If this is the only motivation, then you also need to know that, once you get out of university, no one ever asks you about your IB grade (just like no one ever asks about your primary school grades). This play for pride is just what it is.
Some of you were worrying about "too suspiciously quick turnaround" on other people's EUR. I don't think the conspiracy theory is warranted 😉 Imagine the hell that would break loose if the IB just take your 123 USD and send you a form letter saying there is no change!
Why might a EUR be more accurate? Historically, EURs are handled only by the team leaders, who have done examination of a particular component for at least 4-5 years. This means that they have a broader context to evaluate student work, and so the score assigned is both more precise and accurate. (<- still remember these?) This may play a particularly important role this year, as the IB needed to recruit probably 4--5 times more examiners for the IA, and despite the training, they're still doing it for the first time, and may have limited exposure to, say, ICT IAs. (grrr!)
Why might a EUR NOT be accurate? I marked IAs before, but was never a team leader, so this may not be true there. In other components, team leaders can see the grade and comments from the first round of marking. What this may mean is that their eyes could get tainted from the first round, however haphazard that was; but by the same measure, they could also be seeing the suggested mark / mark-sheet from your teacher, so they get two diverging opinions. I don't know.
# How did you discover this?
DH and I used different investigative techniques. I used non-linear fitting using the Solver Add-in of Excel, whereas he used Wolfram Alpha and (I believe) works analytically on cohort averages.
Since analyses were ran on students' data, I cannot publish the actual underlying data, but can give a general description of what was done. The following video explains, in general, what non-linear fitting does, as well as the procedure for doing one (in the chemistry context). Detailed instructions and a template for doing your own fitting is giving in a later section.
Conceptually, non-linear fitting tells Excel that SM = f(PG, IA), and proposes a specific form of this function but with coefficients unspecified.
- Scaled mark = X(PG) + Y(IA) + Z
or
- Scaled mark = X(PG) + Y(IA)
And ask for the "best" coefficients for a particular model. What Solver does is to iteratively change the coefficients to minimize the deviation.
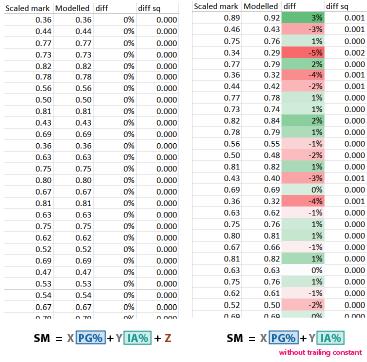
As the IBO scaled marks were generated analytically with no randomness, when a model fits, Solver generates coefficients which fits the data PERFECTLY with no deviations for any student:
On the contrary, when a model doesn't fit, the fit is imperfect on the individual level (even though the macroscopic average may be acceptable). I used perfect fit as the criteria to reject alternative models.
Valid but not unique
Note that a perfect fit says that the equation can be used to predict the results, but it does not say on whether other models or combinations of coefficients is valid. In other words, our empirical models guarantee a match but silent on uniqueness.
As an example, if our fitting procedure gives an equation of
- SM = (0.50 PG%) + (0.40 IA%) + (0.10),
We could get a equally perfect fit with models
- SM = 2 [(0.25 PG%) + (0.20 IA%) + (0.05)], or
- SM = (0.50 PG%) + (0.40 IA%) + (0.07) + (0.03)
These models, however, would suggest different interpretations.
Between a number of collaborators, we have data for
- Eng B / HL / TZ2
- Econ / HL / TZ2
- Bio / HL / TZ2
- Chem / HL / TZ2 (multiple schools)
- Chem / SL / TZ2 (two schools)
- Maths / HL / TZ2
Which gives us confidence that the models is general across subjects that has a "missing exam" component.
# Excel Solver instructions
You can download here a template for doing your own analysis. You will need the PG, IA, and SM for several students.
Using my Excel template, you would fill in the pink-cells,
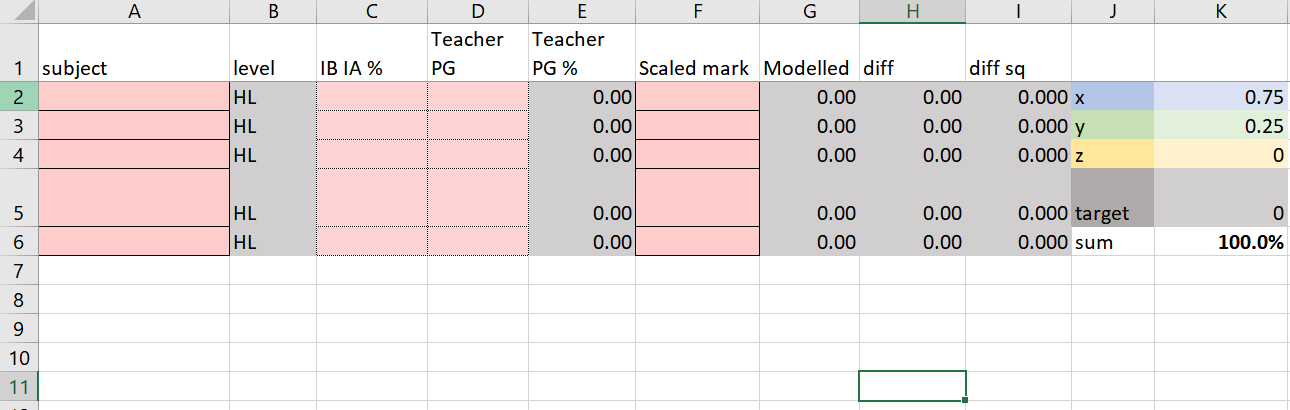
...extending calculations in columns GHI as needed. Start Solver (Data -> Solver); if you don't see Solver in Data, then you need to activate it. It's probably something like File -> Options -> Add-in, but check the internet for your Excel version.
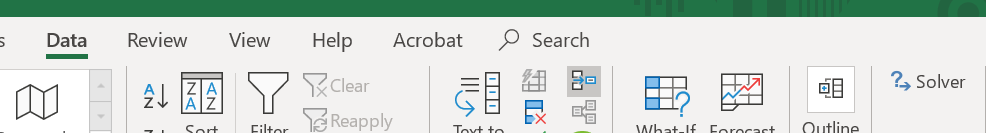
When doing the minimization, the target is $K$5, and you're trying to minimize it by varying K2-K4. The parameters in the Solver window should look like the following:
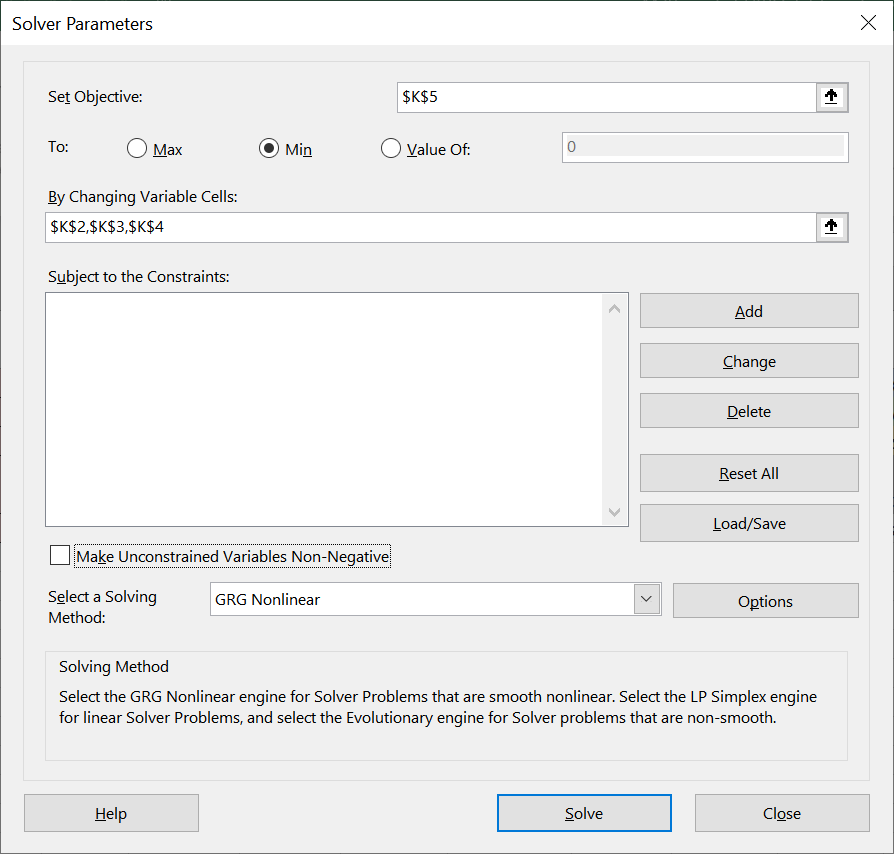
If it goes well, the modelled values in col G would look exactly the same as the actual values in col F, and the diffs would be 0. You can now look at K2-K4 and extract the coeff x(PG)+y(IA)+z.
Other methods
Ferenc Beleznay have cooked up several other ways of fitting and visualizing, and generously shared his work with the world:
If you are using the Google-based solutions, you should File -> Make a Copy to generate your modifiable version. Please do not request Edit access.
# Evaluation
In the next sections, we will move through different levels of the grade award process. We start with the numerical model, then drill down to look at the validity of the components (PG, IA), and finally come back up to view the entire procedure in the context of a grade award.
# Thinking through the numerical model
To describe the process verbally, the Scaled Mark is formed from the PG awarded by the teacher, together with the examiner's evaluation of the IA, modulated with a % that is constant for a subject level. Of these, the major contributor is the PG, accounting for about half of the scaled mark, with the IA accounting for about a third. Even with the trailing constant, they never add up to 100%.
This scaled mark is placed against the grade boundaries, inherited from M19 down to the timezone (TZ) / subject / level granularity, and a IB Grade is awarded for the subject.
In terms of understanding the scaled mark composition process, three mysteries remains, which I suspect are related:
- Where do the co-efficients come from?
- Where does the 7.2% and 9.3% come from?
- How do they interact with the grade boundaries?
# Coefficients
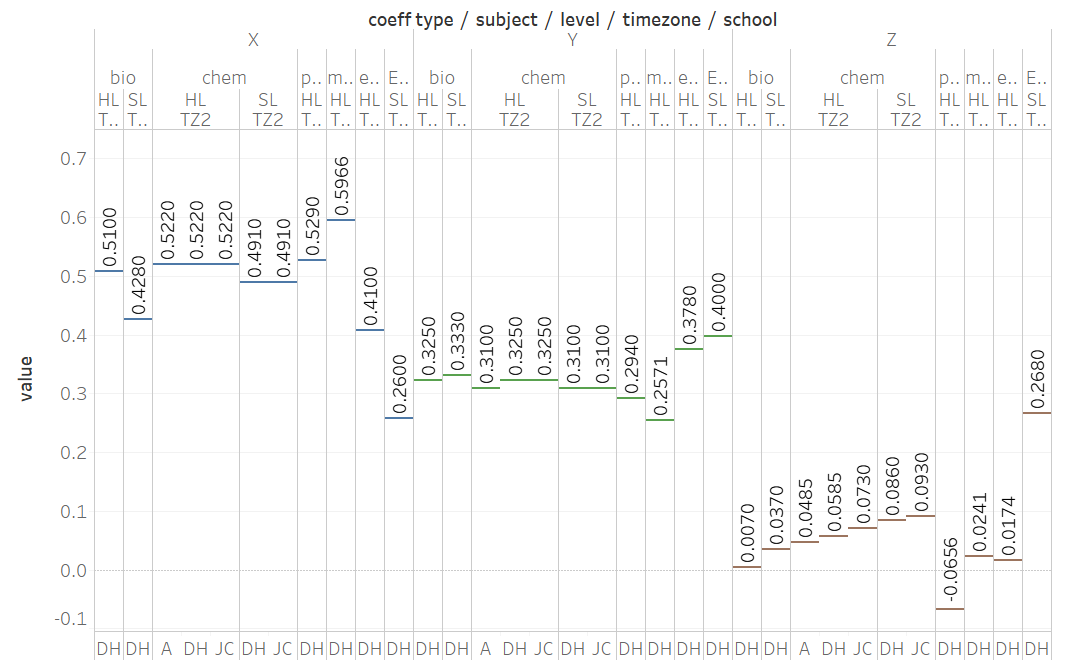
Since X and Y are subject-specific, we will discuss them separately from Z. I note that these are exact but "not pretty" numbers, and is thus likely emerged from an algorithm rather than designed by an educator.
The weighing of the IA is similar amongst a subject group. The Sciences band together between 0.29 and 0.33, and is higher than Maths (0.25) and lower than Econ (0.38) and English B (0.4). This may be related to the quantity of coursework submitted.
Within a subject group, the coefficients vary slightly across levels.
X is the weighing of the Predicted Grade, and across subjects is complementary to the magnitude of Y. Between subject groups, the ranking of Y is
Eng B > econ > sciences > maths
whereas for X it is
Eng B < econ < sciences < maths
X varies narrowly within a subject group, but the reason is unknown.
# Z, the Fudge Factor
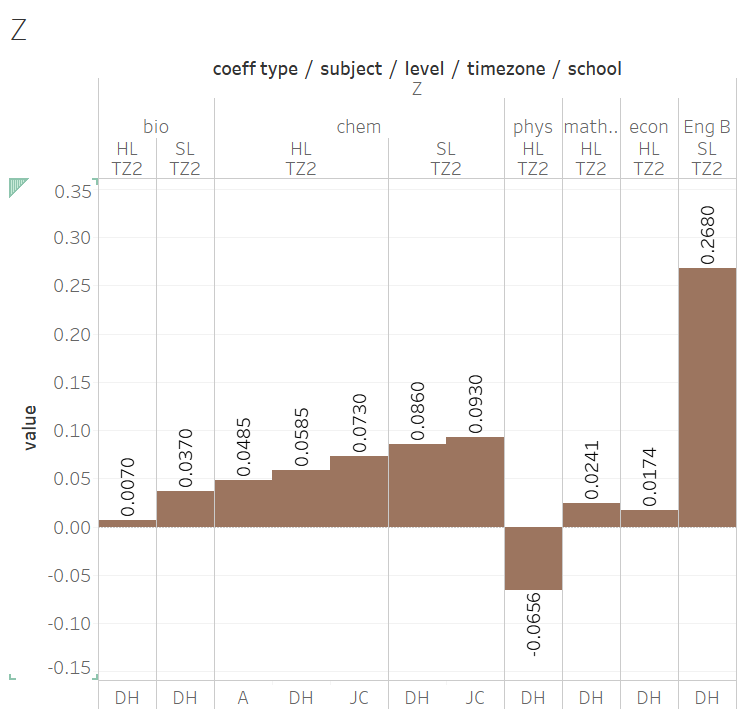
Z is a "modifier" percentage tagged on after the PG/IA had been weighed. It is the same for every student in the same school, but otherwise unique. It is generally small (<10%, with the exception of Eng B), and can take on punitive negative values. Z is, clearly, what the IB called the "historical factors".
Before talking more about this, I'd like to impress upon you, once again, that the equations describe the scaled mark formation perfectly. The corollary is that no other model works, and this extends to the trailing constant.
Z at the end makes the fit absolutely perfect. Without this adjusting term, simply modifying the coefficients (i.e., a model of (X x PG) + (Y x IA) ) could get the overall result to match, but individual student could be off by 3--5%. This term is absolutely in there by design, and this term is specific to the school level.
At the moment we have speculations but not enough data to tease out what Z contains.
I believe that Z depends not only on the history of the school (hence DH refers to it as the School Factor), but I believe Z is also strongly influenced by the subject.
- my suggestion that it is influenced by the subject is due to the large disparity between Z for chem (+6.75) and phys (-6.56) at DH's school. As an academically elite school, I assume the M19 averaged SM and PG for his chem and phys are similar.
- Z seems related to scaled marks in M19
Historical factor
"M19" here is a short-hand for "historical". For large schools with high enrolment in a subject (which is our test cases), only M19 was used. However, it seems that previous cohorts were also used for other schools. DH guesses that as much previous data were pulled until there is a sample size of more than 30 students. This would explain why large schools seem to be affected by 2019 only, whereas small schools seem to be affected by more years.
# Putting the pieces together
We know how the Scaled Mark calculation works, but we don't know why it was designed that way.
Since there is a unique set of coefficient and constants for each subject, level, timezone, and school combinations, there would be too many to be built and checked by hand, and "The Algorithm" must itself have been generated by... an algorithm.
This algorithm-generated Algorithm certainly works on the macroscopic level, and would have passed the majority of the spot checks; these evidence would be why the procedure was approved at first place. But the IB DP is hugely complicated, and I suspect that internally there is no single person that was aware of the myriad of corner cases. As reports storm in, the "Education Statisticians" might be realizing the scope and impact of the situation, and which is why the IBO is agreeing to handle appeals on a school-by-school basis.
An imaginary conversation
The problem is that the devil is in the details, and ignorance is bliss... until July 6th.
The IB DP is so complex that I doubt any single person is fully holding it in their head. Certainly not a contractor statistician; they think it is viable because of their ignorance, and the admin thinks it is viable because of the statistician's assurances. So the discussion of both macro and micro-level probably happened, but the corner cases simply didn't float up.
In fact, I imagine such a conversation:
== BEFORE JUL 6 ==
Stat guy: Wait, Further Maths doesn't have any coursework.
Admin: I thought you knew that.
Stat: Where was this written?
Admin: That information is public.
Stat: [...]
== NOW ==
Admin: What do you mean you've calculated the FM grades using the other subjects? What does Visual Arts grade got to do with FM?
Stat: You approved it.
Admin: I thought you meant using Maths HL!
Stat: ...some students don't do Maths HL, just FM. That information is public.
Admin: [...]
One last observation: the equation is supposed to set the scaled mark, which is a value ranging from 1--100. However, a PG = 7 and IA = 24 gets one of my students to 90% and not 100%; this max percentage is 76% for Physics HL at DH's school. Even knowing that these are modulated by the grade boundaries, I feel queasy about that. We discuss the use of Scaled Mark in a later section, when we evaluate the entire procedure holistically, but for now, let us delve into the generation of the PG% and IA% components and discuss whether they are valid representations of student accomplishments.
On historical averages
I presume the worldwide / regional averages checks out, but I would be curious to see what it looks like on a school level. Our average for M20 Chem HL is -0.46 relative to M19.
Instill meaning into the models
DH proposes a model that would be indistinguishable empirically from what I have been describing:
Scaled Mark = 0.325x(Adjusted IA%) + (1–0.325)x(Adjusted PG%)
(Adjusted IA%) = IA% + Historical average scaled total – Historical average IA%
(Adjusted PG%) = 10*(PG + Historical average grade – Historical average PG) + 15
The constants in the formula (0.325, 10, 15) are specific to subject-level but may be the same for all schools in a time zone. 0.325 reflects the similarity in nature between the subject’s IA and exams, and can be easily estimated from May 2020 data (find two students at the same school-subject with the same PG but very different IA scores and thus different scaled totals, and calculate the weight of the IA). 10 is the average gap between grade boundaries. 15 aligns my formula’s scaled totals with the actual scaled totals.
I thought this hypothesis to be clever, plausible, and elegant. It is, essentially a factored out version of the original proposal, with detailed and still meaningful coefficients. I don't see how we could distinguish between them without a larger data-set that has more historical components.
# Thinking through the components
For the equation to be valid, it requires the input --- PG% and IA% --- to be meaningful.
# PG
The model makes use of current PG, and possibly historical PG (in the fudge factor Z).
What we know about PGs, on a global scale, is limited. I think the IBO stated once in March that in > 55% of cases student's PG deviate from the actual grade by at least one.
My anecdotal experience is that the errors and uncertainties of the PG is specific to the teacher and not the institution. In other words, different teachers of the same subject at the same school can err in dramatically different way, and treating current PG as an extension of historical PG is necessary but flawed.
There is a little noticed slip-up in the technical treatment of the PG. The M20 PG is directly converted into a % by dividing over 7. What looks like a reasonable conversion is actually very strange, as this implies a linear grade-to-mark conversion, without the use of grade boundaries.
There are two possible problems here. The first is that the grade boundaries were never even for any subject; the second is that the actual grade boundaries are often about 10%, and always narrower than 14% (from a straight division). Having had a PG of 5 would means a deduction of 28% compared to a student with PG = 7, and this would be a three grade difference when back-converted using the grade boundaries.
# IA
Compared to a normal year where it weighs 20%, science IAs are now worth heavier at 32% of the scaled mark. And this is where I start complaining and it gets personal...
I think the IA marking is all over the place, and have lots of internal inconsistency between different examiners. In other words, it is inaccurate and imprecise. (This is probably unavoidable since the IBO needed to recruit many more new examiners, and have them work far higher quota, to meet the extra IAs to be marked, but you can't make good tea if the water is polluted at the source!)
The evidence is personal. I've been teaching IB chem for almost a decade, and was once examining IAs too (though I quickly moved onto something with greater certainty). I have a systematic way of assessing each sub-criteria, which then forms the criteria grade. Historically my IA marks are usually judged on par, or on a bad year, "-3 on the top end".
What does this mean? In the past, when scores are moderated down, they are differentially moderated down depending on what ranges they fall in, so "-3 on > 21" might also mean "-1 for work that was between 15-20", and maybe even "+1 on below 10". The overall effect is that the IA mark varies by at most ~10%.
This year, scores are individually examined, and the discrepancy with my samples is frequent and large. Four students were hit with -8. -8 translates into 11% of scaled mark, crossing at least one grade boundary, and in selected cases, two --- just from the IA downgrade.
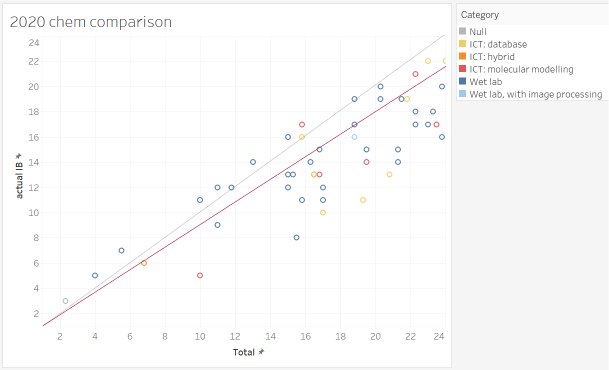
When I grade my own students' samples, the grades form something like an internal ranking, where I compare the IA. If nothing else, they are internally consistent. When graphed against the examiner grades, it is... just a scatter, and is a judgment that my internal ranking is completely invalid. In the above graph, the gray diagonal would be where the points lie if the examiners and I agree; the red line would be the maximum downgrade my students have ever seen historically. 80% of my students were outside the historical boundaries!
Needless to say, I have requested the examiner comments through a Cat 2A EUR. Having seen the examiner's comments confirmed some of my suspicions and introduced issues I didn't think about.
Examiners vary dramatically in how detailed they have commented on the student work. This ranges from very constructive detailed comments, to pasting sections of rubrics, to... no comment beyond "seen" stamps.
- on the student whose work dropped 50% from my expectation, there was not even a "seen" tag. The whole thing was unannotated and just scores were assigned.
there is a systematic error with how ICT projects were assessed. To be blunt, I believe that there are quality database / modeling work my student have done that went over the head of the examiner, and got penalized for that.
- Statistically, note the number of red/orange/yellow point (ICT IAs) that are well-off the diagonal. Were they really quality ICT IAs? As one of the people who developed / led the Cat 3 workshops for "ICT in Chem", and think that the current TSM ICT IA samples are simplistic and over-rated, I think my students' work is very good 😃 (so do some of the examiners)
- very similar ICT IA projects, of which I assigned a similar IA mark, and other teachers find difficult to distinguish which one was better, was assigned marks of a 3 and a 6 respectively (??)
- examiner comments included penalties for not having uncertainties for database values, and didn't state the method / equipment for collecting the data. They just didn't get it.
the six criteria were not applied independently of one another. Incomplete IAs missing the Evaluation section, by the books, should still nonetheless gets its fair treatment for the other five criteria. However, what I see is that all of these incomplete IAs were massacred and assigned single digits.
I think some of the student works were incorrectly rendered by RM assessor and the students were penalized for it (!!!). One examiner repeatedly hammer a piece of student work for broken formatting --- "understanding of the report was further made difficult by the corruption of the document that had diagrams / images and their captions in the wrong place. This was clearly not proof-read before submission." The document looks just fine and nothing like what the examiner said...
Polluted at the source
Note that these all work only if we assume all actors act in good faith. If the data is intentionally polluted at the source, it would all fall apart. Some circles have a culture, where students cheat and the cheating is condoned or supported by parents, teachers, and board. If the students were supplied with universal "7" PGs and permitted to submit commissioned IAs, they would enjoy a massive, perverted advantage.
# Evaluating the overall process
I have a lot of sympathy for the IBO, having to pull a grade out from incomplete knowledge. And so far, despite my grumbling about the IA examining, I think the overall design is conceptually sound.
How the IBO might have generated M20
Knowing what factors were used, I speculate the following procedure on the IBO Statistician's part:
- Select worldwide M19 Scaled Marks, PG, and IA for each subject / timezone / level
- I think this is all internally used as marks (out of 100) and not grades (out of 7), since they have it, but we don't have that in hand. I believe this is true because this would be how they have "grade boundaries", which would otherwise not make sense if they only worked from grades.
- Assume something similar to the following model: Scaled mark = X(PG) + Y(IA) + [A(M19 SM) + B(M19 PG) + C(M19 IA) + D]
- ...define an initial condition (or even boundaries) for X and Y based on the number of coursework submitted. 1 coursework (Grp 4, 5) = 0.25, 2 coursework = 0.4 etc.
- ...define a target involving
- (calc M19 - avg M19) for each school, for minimization not directly, but probably weighed for the number of students enrolled, and the sum squared to penalize outlying results.
- search for X, Y, A, B, C, D for the subject / level / TZ, which minimizes the target
- Check
- overall (avg calc M19 - avg actual M19) ~ 0
- histogram of school deviations is narrow
- Apply it for M20 results
- Fudge the grade boundaries for each subject / TZ / level so that the proportions of 7/6/5/... is as close to M19 as possible
Using Scaled Marks
One of the strange decision made was computing Scaled Marks and then convert with Grade Boundaries, since this creates two parameters that depend on one another. I thought that directly working with IB grades is better, but when I put myself in the shoes of someone who has to write and defend the code, I think I'd use Scaled Marks too. I can think of three reasons why Scaled Marks would be used:
- Different components in different subjects have different "full marks" and different contributions. Working with a standard of full = 100 makes it easier to reason about.
- There is a need to preserve a "high resolution" version for comparison with historical data
- Grade boundaries can be shifted after the fitting exercise, so acts as a mechanism for correcting discrepancies at the end.
Lack of communications
Actually, putting myself in the IBO's shoes explains a lot of things. One of the greatest criticism is how there had been no communication before and after the grading period. This was interpreted as hubris / poor communication / secrecy etc, when there are more well-meaning interpretations.
Before. In the ideal world, we would discuss as a community about how the grades will be generated, and choose "the best method". In the real world, there are cultures where cheating is systemic, done with the condonement & participation of parents, teachers, and board. A thus-corrupted school, knowing the formula, would realize that there is nothing preventing them from giving 7s to every student (since there is no comparison of M19 and M20 PG being done). There would also be more pressure to generate IAs (wink wink) that are excellent (wink wink).
After. I've on-off thought about these for years, and after spending two full days on one set of data, I still struggle to fully grasp what this one set of coefficients mean for my students. How could the IBO address the deluge of 10000 of complains, some of which are well-grounded (like the FM teachers here) and others are opportunistic?
- I have known many characters in the IBO for a number of years. I respect all of them, and believe they are well meaning with the wellness and fairness of the young people in their hearts. So why don't they fix the wrongs? Well, at this point, the grade mechanism is a rigid, crystallized, interlocked puzzle, where it all would fall apart unpredictably when you substitute another piece. In other words, if you don't even know what it is doing, how could you attempt to fix it?
The unfortunate thing here is that we have a description of what was done, and given any set of student scores, we can find out the specific. What we don't have is any reasoning for why it was done in a particular way, and that is just not very satisfying.
As humans, most of you really read up to this point to find out whether the grades had been fair. This is a complex question, as we are thinking about fairness across many dimensions: subject, level, timezone, school, socio-economic status, race, ...and so on. Many of these we just don't have the data to evaluate.
# Fairness across subjects
One that that I noticed we can evaluate is what I call a "subject path". Since teachers predict PG and examiners assess IAs with neither knowledge of their weighing nor grade boundaries, the same {PG,IA} combination should yield the same IB grade. This is impossible to assess intuitive because the weighing and grade boundaries are interdependently different for the subjects, levels, and timezones.
However, with knowledge of all the coefficients and grade boundaries, we can re-create all the possible combinations. This was done by:
- simulating out Scaled Marks for all the possible combinations for chem/bio/phys HL TZ2, using Dan and my coefficients
- assigned an IB grade for the SM using the grade boundaries (note - I fudged the boundaries for 1 and 2 from earlier years because I don't have that info. The grade boundaries are also crowd-sourced and may be off by 1% or 2%. Need help from a coordinator.)
- graphed it as a heat-map.
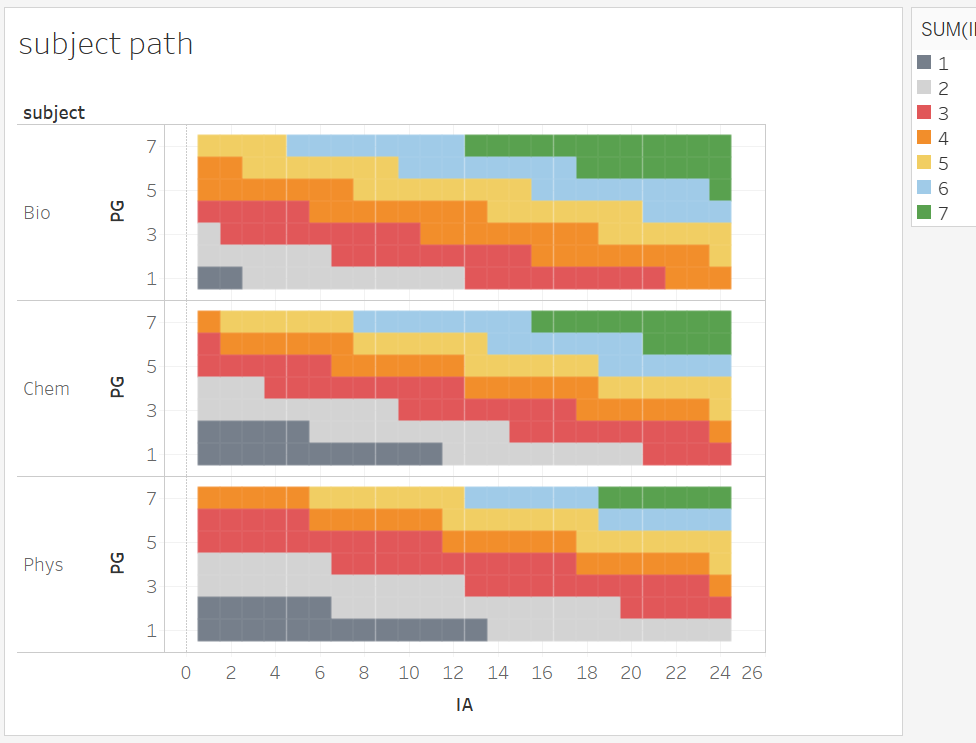
The result is complex even when presented in a visual form. What we can see, however, is that the grade boundaries do not completely "neutralize" the effects of very different Z. The result is that there is far fewer paths for physics to achieve a 7 (6 / 168 possibilities) than bio (20!), and explains some anecdotal observations where the IB grade is lower than both the PG and the IA grade.
So. The answer to "is it fair" between the Sciences subjects is (IMO) a resounding NO. (Unless we believe that physics teachers were prone to over-predict.) A student who have, in Sep 2018, chosen Bio HL, is likely to have a higher grade than the counter-factual of her having chosen Phys HL. This cannot be an intended behaviour, but I suspect it simply emerged out of the interlocked procedures of "the algorithm" and was never even detected until our little exercise here.
There are lots to think about based on this graph. What I want to do next is to evaluate the subject path for same subject / level, across timezones. They better be identical...
Help needed
If you are a coordinator / teacher with access to M20 TZ1 (Americas) science data, please consider reaching out.
# Fairness across schools
A second question that many people would be interested in is, if two students with identical accomplishment took the same subject, but they did so at different schools (in the same TZ), would they get the same mark / grade? The answer is nuanced.
If we were to be very specific, and drill down to the mark level, the answer is No. This is because, even though their PG and IA are identical, and these are weighed identically, the Fudge Factor Z depends on the history of the school. Enrolment in a historically higher-achieving school gives a better mark. I suspect a phrasing this way makes many people uncomfortable, but this is absolutely by design.
If we take a step back, however, the variance due to school is comparatively small; the "school bonus" is probably 2--3%, which is one-fifth of a grade.
"But any advantage is an unfair advantage!", you say. In this case, I'd say to take a step even further back: two students, identical in ability, enrolling in different schools would get two different experiences. They have different peers, different teachers, and different activities. Even in the same subject, they would have different paths of development and would probably end up with different accomplishments in each subject; some better, some worse. This is adding to the uncertainty where who-marked-the-IA matters on the order of 15%; holistically the 2--3% is truly minor.
Data unavailable
What I am very curious is how the IBO statisticians handled cases where there was no past data, or insufficient past data, available to construct Z. This would be true in the case where there is a new syllabus being examined, or new school. It's no longer pulling rabbits out of hats; it's pulling rabbits out of hats where there wasn't even a hat.
# Conclusion
The pandemic is not a choice, and the IBO decided that they need to fulfill their duty in assigning grades. They have developed a model that rolls together lots of data to evaluate a grade. It's a complex process that is tailored for each time-zone, each school, each subject, and each subject level, and one that the IBO is holding secret up to now.
The central finding here is that, hey, the complex model is not actually so complex, and (at least for chemistry) the Scaled Mark is formed from three components:
- (March 2020) PG by the teacher
- (externally assessed) IA mark
- a fudge factor, that is usually small in magnitude, and encapsulates contextual factors
This Scaled Mark is then applied against subject-specific grade boundaries (mostly similar to M19) to generate an IB grade.
What do I think? For the most part, it's the best that can be done for the circumstances. It's not perfect but there was no perfect possible here.
No, what do you *really* think?
I think our education system is flawed. As in, the idea that society should put people in school, Sep-July, until they are 24, then set them off into the world, is bizarre. As in, the notion of examinations is mostly a credentialing exercise, and would do well to be replaced by more functional activities.
As in, I love learning, and as a PhD chemist, with 4.xx GPA in multiple majors, > 45 IB points, "the system" has treated me well, but I still believe that at least 80% of my schooling was a waste of time. As in, I wish we can re-imagine society around learning, but not in the way that we are doing it. I think we can do better.
I have a lot of sympathy for the IBO feeling that they need to pull a rabbit out of the hat. I believe that they have worked with good hearts, and with generous respect, care, and consideration --- in an equally tough personal times for them --- but I have the feeling that they are going to get mired in many, many lawsuits.
If they gets sued, it's going to get dragged on for years. Humans (and their lawsuits) operate in a world of Why, but while the numbers are easy to extract, they probably were empirical and does not have a meaning. And even in the empirical world, no one even knows how you can judge whether the mechanism is good or not: should we accept macroscopic metrics, or must we look at individuals? Theoretically we would look at the individuals, but there we have no counterfactuals to compare against, so the case is uncertain.
What I am certain is that, when this blows over, we'll have a new, awesome Nature of Science and Theory of Knowledge example 😃