# Reverse-engineering the M20 IB "Algorithm"
With the coronavirus pandemic causing worldwide disruption, the IBO made the decision to:
- Cancel the May 2020 (M20) exams, and
- Calculate a grade using "an algorithm"
Since the results were released on 6 July 2020, there had been lively discussions between students, teachers, parents, and schools. Despite usually very thoughtful and generally considerate of what is a difficult time for everyone, few of these conversations can go very deep, because "the algorithm" remains unknown.
In the past week, equipped with full data from a large cohort (I teach > 50 Year 2 chem students at both levels), I have reverse engineered how the grades were calculated. The numbers seen here is specific to a school / subject / level combination, but I expect the general model to broadly hold true.
Caveats
I want to do more illustrations for this article, but they will take time and may not be forth-coming.
I work with the IBO on various things, but I have no special insider knowledge about grade calculations. All my findings here are empirical.
This is my writing, and does not represent the IBO or LPCUWC, the school I teach at.
I'm hearing back from different sources, and the article is getting updated when I wrap my head around the new developments
# Terms
"Grade" and "marks" are usually used interchangeably, but in this article I am going to use them with specific meaning. Grade is used for a value between 1--7, that represents the gross achievement, whereas mark is an absolute value out of some arbitrary maxima, and accepts fine increments.
- IB grade. This is the number, out of 7 (maximum), that students receive as an indication of their achievement in a subject, as defined in grade descriptors. This is constructed from the scaled mark, using the grade boundaries.
- Grade descriptors. These are descriptions of what a student should be able to do / think, in order to deserve a particular grade. These are applicable to an entire subject group (e.g., sciences) An example: to earn a grade 7 in the sciences, a candidate should "display comprehensive subject kowledge and a thorough command of concepts and principles. Selects and applies relevant information, concepts, and principles in a wide variety of contexts. [...and it goes on and on!]"
- Scaled mark. The scaled mark is a number, out of 100, that takes into account everything the IBO knows about a student. In a normal year this would be composed from exams and coursework. For each subject, the scaled mark is compared against the subject grade boundary, and used to generate the IB grade.
- Grade boundaries. Because exam papers vary in terms of difficulty, the same raw number reflects different achievement. In a normal year, after the exam session, the Grade Award Committee classifies a pile of (ungraded) papers into bins that they believe fulfill progressive grade descriptors. They argue about what papers fall in what bins, and then when that's settled, the papers are marked, and the numbers used to generate the grade boundaries that are specific for each paper. This initial boundary gets amended by polling the examiners (or only senior examiners?)
- Predicted Grades (PG). PG refers to many things, but in this article, PG is a number, out of 7, that teachers submit to the IBO around March 2020. It encapsulates everything that a teacher knows of a student, and thus would predict the a final grade to be. In a normal year, this PG is used as a protective mechanism, triggering automatic reviews of scripts if the IB grade is wildly off.
- IA mark. For the sciences, there is only one piece of coursework, and that is called the Internal Assessment (IA). It is marked with six criteria, and the maximal mark is 24. In a normal year it counts for 20% of the scaled mark.
- IA grade. This is the IA mark (out of 24) converted using the grade descriptors into a grade. In almost all context this is... useless, so I won't use this term.
# Method
...because these analyses were ran on students' data, I can't publish the actual underlying data, but when time allows, I can write about the process so you can run your own analysis as well.
The process makes use of the non-linear fitting Solver Add-in on Excel, and would require your current students' PG, IA, and scaled mark as numbers out of 100. As the IBO scaled marks were generated analytically with no randomness, I think it would even work with extremely small sample sizes of 2--3.
# Results
For chemistry, there is only one IA component, so the reverse engineering is easy. My cohort of IB scaled marks can be perfectly modelled using
HL scaled mark = (0.522 x PG%) + (0.325 x IA%) + 7.2%
SL scaled mark = (0.491 x PG%) + (0.310 x IA%) + 9.3%
The modeling can be perfect only if HL and SL are treated separately (implications discussed below). The coefficients come out very similar but not the same.
Before moving on, let me press upon you the fact that the fit is perfect, not just "on average", but with zero errors for any of the > 50 students. This is what the comparison spreadsheet looks like:
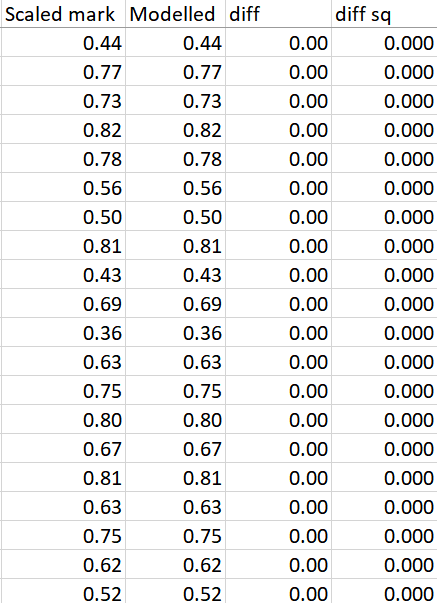
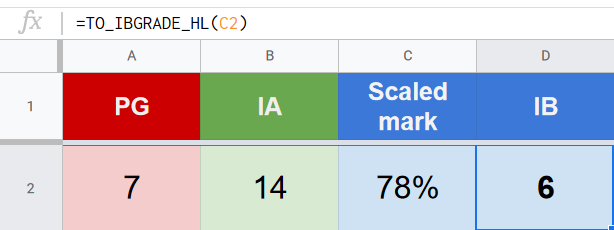
I've built a calculator for my students (and you!) to play with the possible outcomes here.
The 123 USD question
"I am a chem student disappointed with my grade. Should I ask for a re-mark?" There are three factors to consider: the likelihood of success, the practical impact on your future, and principle.
Likelihood of success. If you are not my student, the specific numbers won't apply to you, but your IA is probably still 32% of your Scaled Mark. Speak with your teacher, and see what your IA is likely to get as a max, then see if that is going to change your Scaled Mark.
- For example, if your IA is currently 11, and your teacher thinks that it deserves 20, then there is a possibility that your scaled mark can go up by [(20-11)/24]x32% = 12%. A 12% increase brings your scaled mark across a grade boundary, so it is meaningful to give it a try.
- On the other hand, if your IA is currently 17, and your teacher thinks it deserves 20, then your max increase would be 4%. If you are 5% away from a grade boundary, then even if your IA gets maximally marked up, it would still not change your IB grade. In this case it is not worthwhile to appeal.
Practicality. If you are short of a university offer because of the chem grade, and you have a good likelihood of success, I'd say yes, go for it.
Principle. Another word for this is... pride. If this is the only motivation, then you also need to know that, once you get out of university, no one ever asks you about your IB grade (just like no one ever asks about your primary school grades). This play for pride is just what it is.
Some of you were worrying about "too suspiciously quick turnaround" on other people's EUR. I don't think the conspiracy theory is warranted 😉 Imagine the hell that would break loose if the IB just take your 123 USD and send you a form letter saying there is no change!
Why might a EUR be more accurate? Historically, EURs are handled only by the team leaders, who have done examination of a particular component for at least 4-5 years. This means that they have a broader context to evaluate student work, and so the score assigned is both more precise and accurate. (<- still remember these?) This may play a particularly important role this year, as the IB needed to recruit probably 4--5 times more examiners for the IA, and despite the training, they're still doing it for the first time, and may have limited exposure to, say, ICT IAs. (grrr!)
Why might a EUR NOT be accurate? I marked IAs before, but was never a team leader, so this may not be true there. In other components, team leaders can see the grade and comments from the first round of marking. What this may mean is that their eyes could get tainted from the first round, however haphazard that was; but by the same measure, they could also be seeing the suggested mark / mark-sheet from your teacher, so they get two diverging opinions. I don't know.
In the next sections, we will move through different levels of the grade award process. We start with the numerical model, then drill down to look at the validity of the components (PG, IA), and finally come back up to view the entire procedure in the context of a grade award.
# Thinking through the numerical model
To describe the process verbally, the Scaled Mark is formed from the PG awarded by the teacher, together with the examiner's evaluation of the IA, modulated with a % that is constant for a subject level. Of these, the major contributor is the PG, accounting for about half of the scaled mark, with the IA accounting for about a third. Even with the trailing constant, they never add up to 100%.
This scaled mark is placed against the grade boundaries, inherited from M19 down to the timezone (TZ) / subject / level granularity, and a IB Grade is awarded for the subject.
In terms of understanding the scaled mark composition process, three mysteries remains, which I suspect are related:
- Where do the co-efficients come from?
- Where does the 7.2% and 9.3% come from?
- How can they NOT add to 100%? (mine add up to 92% for HL, and 89% for SL)
BREAKING DEVELOPMENT
Shout out to D.H.. He applied the formula to his cohort, and discovered that once he modify the trailing constant, the equation fits all his chem students perfectly too.
This is suggesting that the coefficients (weighing of PG and IA) is constant for a particular subject / level / timezone, with the rest of the "very complex" things compressed into the constant. The implications is huge, and I'm still wrapping my head around it. I'll update the other parts of the article later.
In the mean time, if you are a teacher, there is a discussion thread on myIB DP Chemistry, where you can find information about how to contribute to this research.
# Coefficients
The co-efficients are, clearly, what the IB is calling the "historical factors". What clues do we have about their origin? Exercising Occam's razor, it could plausibly be linearly added:
The teachers who taught the 2019 / 2018 / 2017 cohorts over-predicted by 0.30, 0.18, and 0.72 on average (for HL), which corresponds to 5.7% (0.4 / 7). One possibility is that this 5.7% is simply chopped off the top; in other words, IF the 2019 predictions were bang on, the calculation would have been
HL scaled mark = (0.579 x PG%) + (0.325 x IA%) + 7.2%
OR
HL scaled mark = (0.522 x PG%) + (0.325 x IA%) + 12.9%
Within the limits of my data, the case for these is plausible.
Alternatively, the historical effect could be applied as (i) a multiplier upon the coefficient, or (ii) sliding or proportion between PG-IA. I don't have a full set of other subjects' current and historical data to work with, so I cannot evaluate these possibilities.
# Fudging factor
Before talking about this, I'd like to impress upon you, once again, that the equations describe the scaled mark formation perfectly. The corollary is that no other model works, and this extends to the trailing constant.
The 7.2% at the end makes the fit absolutely perfect. Without this adjusting term, simply modifying the coefficients (i.e., a model of (X x PG) + (Y x IA) ) could get the overall result to match, but individual student could be off by 2%. This term is absolutely in there by design, and this term is specific to the subject level.
I speculate this is a fudging factor the IB applied at the end, after they have processed the grades, to make sure the average matches the "historical averages". Which, if true, makes the claim of "it matches the historical data" funny --- because that is exactly what the equation is trained to do on a numerical level!
On historical average
Actually, I'm not sure what it is in-line with; our average for M20 is -0.46 relative to M19.
# Putting the pieces together
We have established that the arbitrary factor (+7.2%, +9.3%) is subject level specific. Because our HL and SL students' historical records are similar, I don't have enough data to untangle them. However, I cannot get a perfect fit unless I separate HL and SL students, so this is a special factor tailored for entire subject-level cohort.
The equation is supposed to set the scaled mark, which is a value ranging from 1--100. However, a PG = 7 and IA = 24 gets one of my students to 90% and not 100%; I feel queasy about that. Without knowing why the designer of the protocol thinks this is the way to go, I cannot speculate if this is by design or... an unintentional mistake.
Unintentional mistakes
Since there is a unique set of coefficient and constants for each subject, level, timezone, and school combinations, there would be too many to be built and checked by hand, and "The Algorithm" must itself have been generated by... an algorithm.
This algorithm-generated Algorithm certainly works on the macroscopic level, and passes the majority of the spot checks; these evidence would be why the procedure was approved at first place. But the IB DP is hugely complicated, and I suspect that internally there is no single person that was aware of the myriad of corner cases. As reports storm in, the "Education Statisticians" might be realizing the scope and impact of the situation, and which is why the IBO is agreeing to handle appeals on a school-by-school basis. Yikes.
# Thinking through the components
For the equation to be valid, it requires the input --- PG, and IA --- to be meaningful.
# PG
The model makes use of both historical PG and current PG.
What we know about PGs, on a global scale, is limited. I think the IBO stated once in March that in > 50% of cases student's PG deviate from the actual grade by at least one.
My anecdotal experience is that the errors and uncertainties of the PG is specific to the teacher and not the institution. In other words, different teachers of the same subject at the same school can err in dramatically different way, and treating current PG as an extension of historical PG is necessary but flawed.
# IA
Compared to a normal year where it weighs 20%, IAs are now worth heavier at 32% of the scaled mark. And this is where I start complaining and it gets personal...
I think the IA marking is all over the place, and have lots of internal inconsistency between different examiners. In other words, it is inaccurate and imprecise. (This is probably unavoidable since the IBO needed to recruit many more new examiners, and have them work far higher quota, to meet the extra IAs to be marked, but you can't make good tea if the water is polluted at the source!)
The evidence is personal. I've been teaching IB chem for almost a decade, and was once examining IAs too (though I quickly moved onto something with greater certainty). I have a systematic way of assessing each sub-criteria, which then forms the criteria grade. Historically my IA marks are usually judged on par, or on a bad year, "-3 on the top end".
What does this mean? In the past, when scores are moderated down, they are differentially moderated down depending on what ranges they fall in, so "-3 on > 21" might also mean "-1 for work that was between 15-20", and maybe even "+1 on below 10". The overall effect is that the IA mark varies by at most ~10%.
This year, scores are individually examined, and the discrepancy with my samples is frequent and large. Four students were hit with -8. -8 translates into 11% of scaled mark, crossing at least one grade boundary, and in selected cases, two --- just from the IA downgrade.
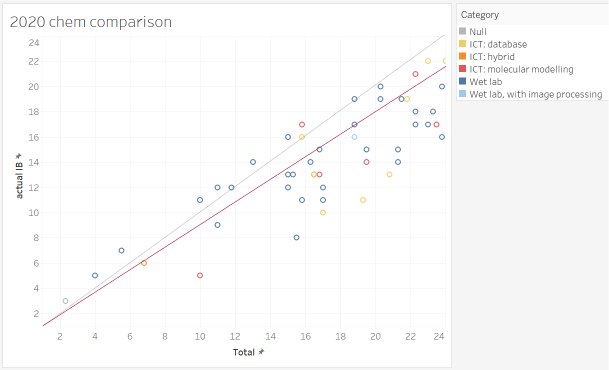
When I grade my own students' samples, the grades form something like an internal ranking, where I compare the IA. If nothing else, they are internally consistent. When graphed against the examiner grades, it is... just a scatter, and is a judgment that my internal ranking is completely invalid.
Needless to say, I am looking forward to seeing the comments from the Cat 2A EUR.
Digging deeper into the specific student work, I suspect a pair of examiner errors:
there is a systematic error with how ICT projects were assessed. To be blunt, I believe that there are quality database / modeling work my student have done that went over the head of the examiner, and got penalized for that.
- Note the number of red/orange/yellow point (ICT IAs) that are well-off the diagonal. Were they really quality ICT IAs? As one of the people who developed / led the Cat 3 workshops for "ICT in Chem", and think that the current TSM ICT IA samples are simplistic and over-rated, I think my students' work is very good 😃 (so do some of the examiners)
- very similar ICT IA projects, of which I assigned a similar IA mark, and other teachers find difficult to distinguish which one was better, was assigned marks of a 3 and a 6 respectively (??)
the six criteria were not applied independently of one another. Incomplete IAs missing the Evaluation section, by the books, should still nonetheless gets its fair treatment for the other five criteria. However, what I see is that all of these incomplete IAs were massacred and assigned single digits.
Polluted at the source
Note that these all work only if we assume all actors act in good faith. If the data is intentionally polluted at the source, it would all fall apart. Some circles have a culture, where students cheat and the cheating is condoned or supported by parents, teachers, and board. If the students were supplied with universal "7" PGs and permitted to submit commissioned IAs, they would enjoy a massive, perverted advantage.
# Evaluating the overall process
I have a lot of sympathy for the IBO, having to pull a grade out from incomplete knowledge. And so far, despite my grumbling about the IA examining, I think this is valid.
And then, at the "scaled mark -> IB grade" process, it all falls apart. The use of grade boundaries is inappropriate --- I think it is appalling --- and likely an oversight. The IBO is probably going to get sued over this.
The fact that the boundaries are highly similar to the M19 boundaries suggest that it is simply inherited (with unknown adjustments). However, this skips over the point that the variations in grade boundaries is to adjust for difficulty differences in the exam papers, which do not exist in M20.
This year, the inputs are restricted to PG and IA, and are agnostic to subject, level, nor timezone. However, the grade output is determined by the subject, level, and timezone.
Practically, this means that a student of mine, with PG = 5, and IA = 10 / 24, gets 58%. For Chem TZ2 HL, this translates into a "4". If she just do chem in the Americas, this 58% would still earn her a "5" (??). How is this legit?
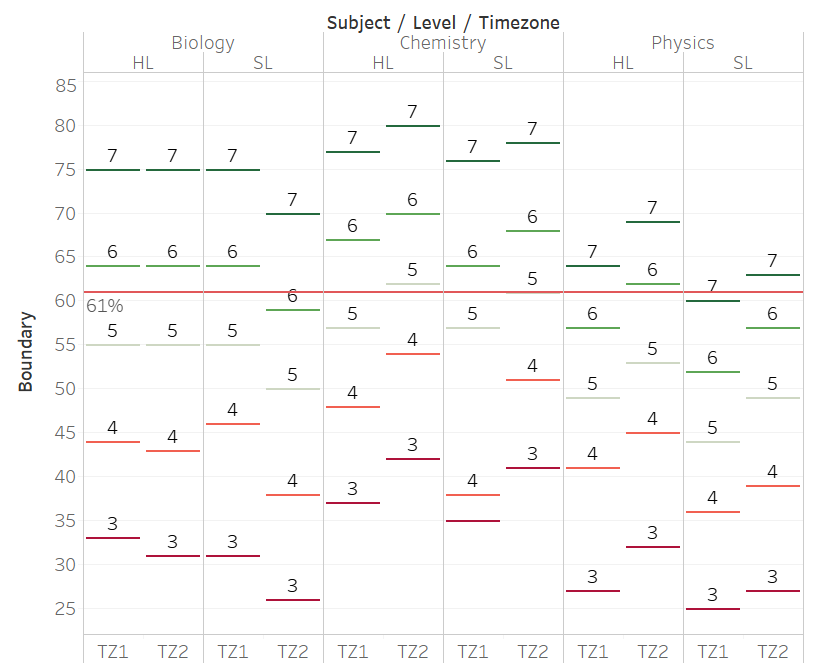
This graph shows how wild the grade boundaries are, for three sciences that have similar examining structure. For this to be valid, it requires that teachers assign PGs differently across subjects, across levels, and across timezones; or IAs are marked differently across subjects, across levels, and across timezones.
But if PGs and IAs are changes with subject / levels / timezones, then there could be no meaningful comparison of them, and the entire exercise is invalid. The use of PG and IA as input for varying grade boundaries is a contradiction. Let me repeat this: I think it is appalling --- and likely an oversight. The IBO is probably going to get sued over this.
In the most extreme cases (illustrated for 61%), the same face-value % could have gotten a student either a 4 or a 7.
Personally, as someone who teaches mostly Chem HL TZ2, I feel that my students were treated unfairly, and feel quite upset about it.
# Conclusion
The pandemic is not a choice, and the IBO decided that they need to fulfill their duty in assigning grades. They have developed a model that rolls together lots of data to evaluate a grade. It's a complex process that is tailored for each time-zone, each school, each subject, and each subject level, and one that the IBO is holding secret up to now.
The central finding here is that, hey, the complex model is not actually so complex, and (at least for chemistry) the scaled mark is formed purely from four components:
- (March) PG by the teacher
- (externally assessed) IA mark
- historical PG plays a role in either the weighing of (1) and (2), or as the fudge factor
- historical grades plays a role in either the weighing of (1) and (2), or as the fudge factor
This scaled mark is then (tragically, inappropriately, unfairly) applied against the M19 grade boundaries to generate an IB grade.
What do I think? For the most part, it's the best that can be done for the circumstances. Mind you, my context is one of a large cohort, with lots of past history to go with, and at least one piece of coursework. In the cases of low enrollments, new schools, Further Maths (where there is no coursework), I don't know how the prediction could be valid. (Maybe there is a different model there, but I don't know.)
No, what do you *really* think?
I think our education system is flawed. As in, the idea that society should put people in school, Sep-July, until they are 24, then set them off into the world, is bizarre. As in, the notion of examinations is mostly a credentialing exercise, and would do well to be replaced by more functional activities.
As in, I love learning, and as a PhD chemist, with 4.xx GPA in multiple majors, > 45 IB points, "the system" has treated me well, but I still believe that at least 80% of my schooling was a waste of time. As in, I wish we can re-imagine society around learning, but not in the way that we are doing it. I think we can do better.
I have a lot of sympathy for the IBO feeling that they need to pull a rabbit out of the hat. I believe that they have worked with good hearts, and with generous respect, care, and consideration --- in an equally difficult personal times for them --- but I have the feeling that they are going to get mired in many, many lawsuits.