# Paperwork
# Tests and Quizzes
# Y1
# Y1 Exam
# Info
- When? 3 May (Fri) afternoon session
- How?
- 1 hour of Paper 1. This consists of 40 multiple choice questions. Answer on the bubble sheet. No calculators or Data Booklets are permitted, but a Periodic Table is supplied at the end of the questions. You can tear off this periodic table for reference.
- 1 hour of Paper 2. This consists of 40 points of short answers. Data Booklets are provided, and calculators are permitted.
- What? See "topics" section below for a listing of what content is included. Use the Filter and Sort functions to identify what is in HL/core syllabus. Questions from previous tests reappears in both papers. Please do not make the same mistakes again.
- How do I do well?
- If you have been doing 3.5 hr / wk of practice every week, and Anki decks for maintenance, then in this week just do some of the past Y1 exams (printed for you). Review your past mistakes in previous tests.
- If you have had some weeks on, some weeks off, and irregular Anki decks, then in this order (as time allows):
- Practice with end-of-textbook questions,
- Review your previous tests,
- Practice with past papers by topics,
- Practice with past tests (printed)
# Topics
# Grade calculations
Term grades calculations are tabulated as follows:
| Test | Quizzes | Labs | |
|---|---|---|---|
| Term 1 | 80% | 20% | - |
| Term 2 | 60% | 20% | 20% |
| Term 3 | 80% | 20% | - |
Composed grades are formed from term grades and exams:
| Term 1 | Term 2 | Y1 exam | Term 3 | Trials | IA | |
|---|---|---|---|---|---|---|
| Year 1 | 20% | 60% | 20% | - | - | - |
| PG (Nov) | 15% | 25% | 30% | 30% | - | - |
| PG (Nov)* | 0% | 30% | 30% | 40% | - | - |
| Term 4 | - | - | - | - | 80% | 20% |
Predicted grades admit the following exceptions:
- language / background disadvantage. Students who had significant language/academic background deficiency will have their Term 1 grade omitted.[1]
- IA. IAs that are likely to be significantly better / worse than current performance gets a modifier. This is usually < ±5%.
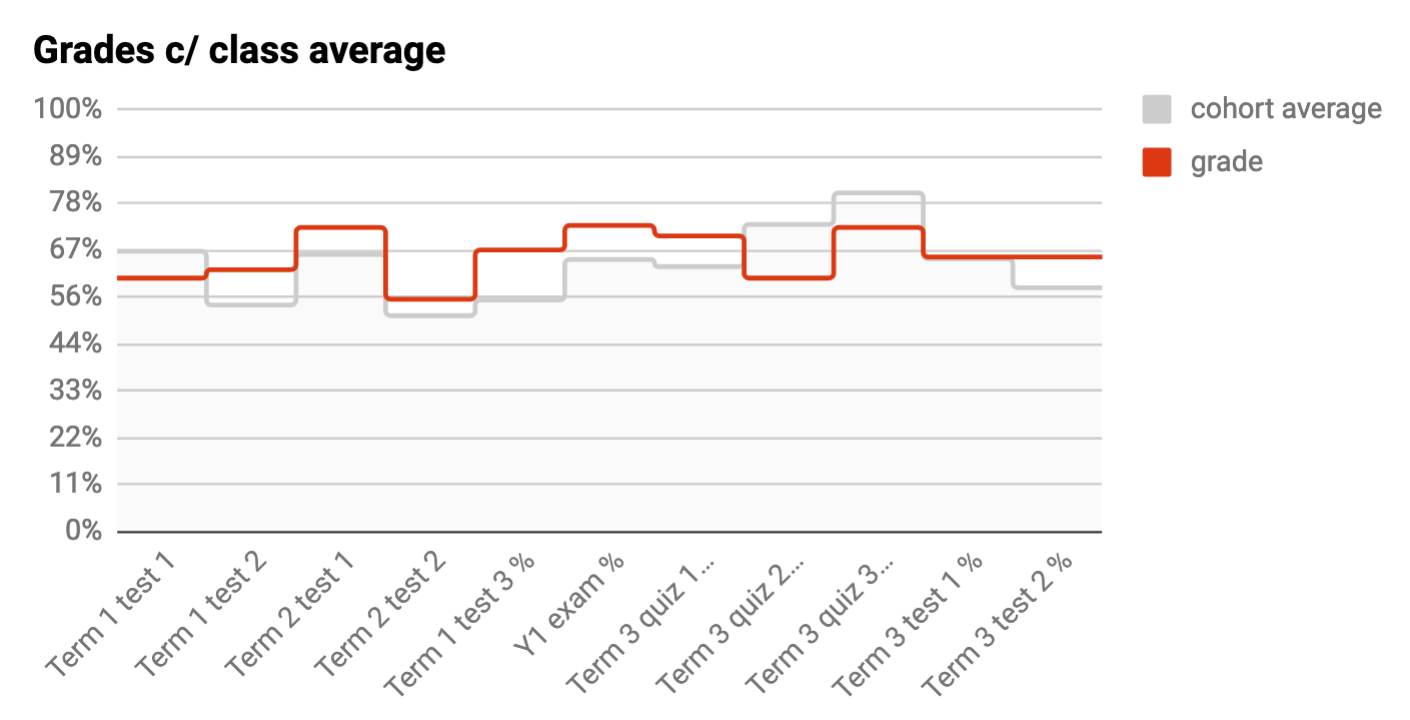
Once a term I email each of you a graph with all assessments plotted as a time-series. This is to help you help me make sure my numbers are legit, and for you to get a sense of your progression.
# Grade boundaries
Our internal grade boundaries are based on the IB chemistry grade boundaries. The distribution is as follows:
| % | Grade |
|---|---|
| 80+ | 7 |
| 70-79 | 6 |
| 60-69 | 5 |
| 49-59 | 4 |
| 35-48 | 3 |
| 19-34 | 2 |
# Effort Grades
Each term you are also given an Effort Grade. For me, Effort Grade defaults to a D. This is then modified up by
evidence of practice / maintenance. As a general rule of thumb,
| EG | Practice (hr/wk) | Maintenance (min) |
|---|---|---|
A | 3.5 | 10; 5 d/wk |
B | 2 | 10; 2 d/wk |
C | 1 | 10; 1 d/wk |
D | cram before quizzes / tests | n/a |
I periodically sample the Big Chart for evidence. If you practice in other ways you need to show me evidence for them. I do not take intentions as substitute for actions.
The science department has a set of descriptors posted on the wall. These include attendance and attitude. For me some are expectataions, and others are quite subjective. These factor in the consideration in a minor way.
In practice I just calculate both variants for each student, and take the better one. Too-clever kids believe they can game the system and waltz throughout Term 1. Their poor preparations will dig them into a hole. ↩︎