# Session 2: Many Many
Until now you have learnt separate parts of a larger puzzle w.r.t. both chemistry:
- to see individual molecules statically,
- to make calculations involving large number of molecules
...and measurements:
- to make single measurements repeatedly (e.g., with a volumetric pipette), and
- to show a range of measurements using either
- significant figures (implicit), or
- uncertainties (explicit)
Today you will learn to:
- see and graph speeds of many particles, and
- calculate the uncertainty from repeated measurements
# Visualizing Multiple Particles in Time
# Using Live Lab
Start by exploring the Live Lab feature in AtomSmith, following the instructions in the printed notes.
# Viewing the Kinetic Energy Distribution
When you are done, click on Options -> Open Kinetic Theory Chart:
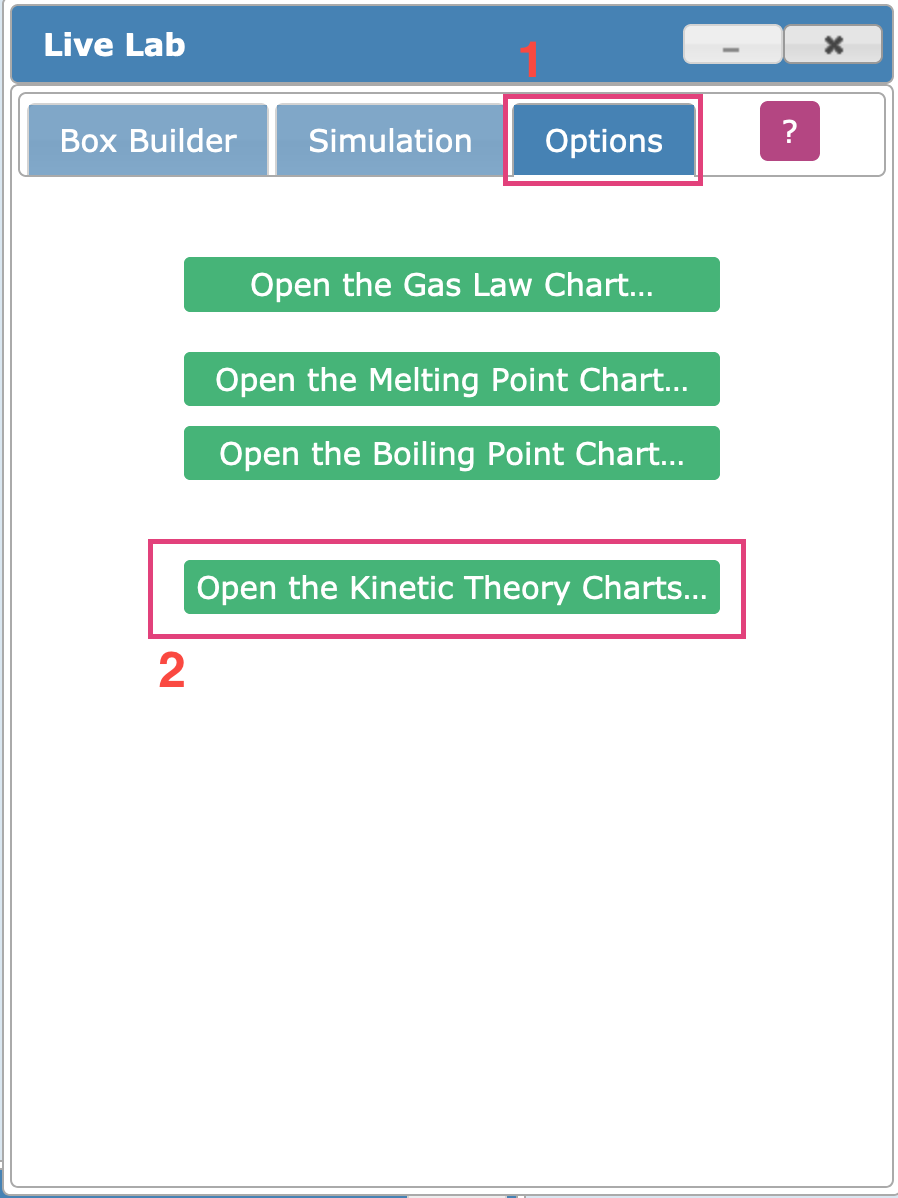
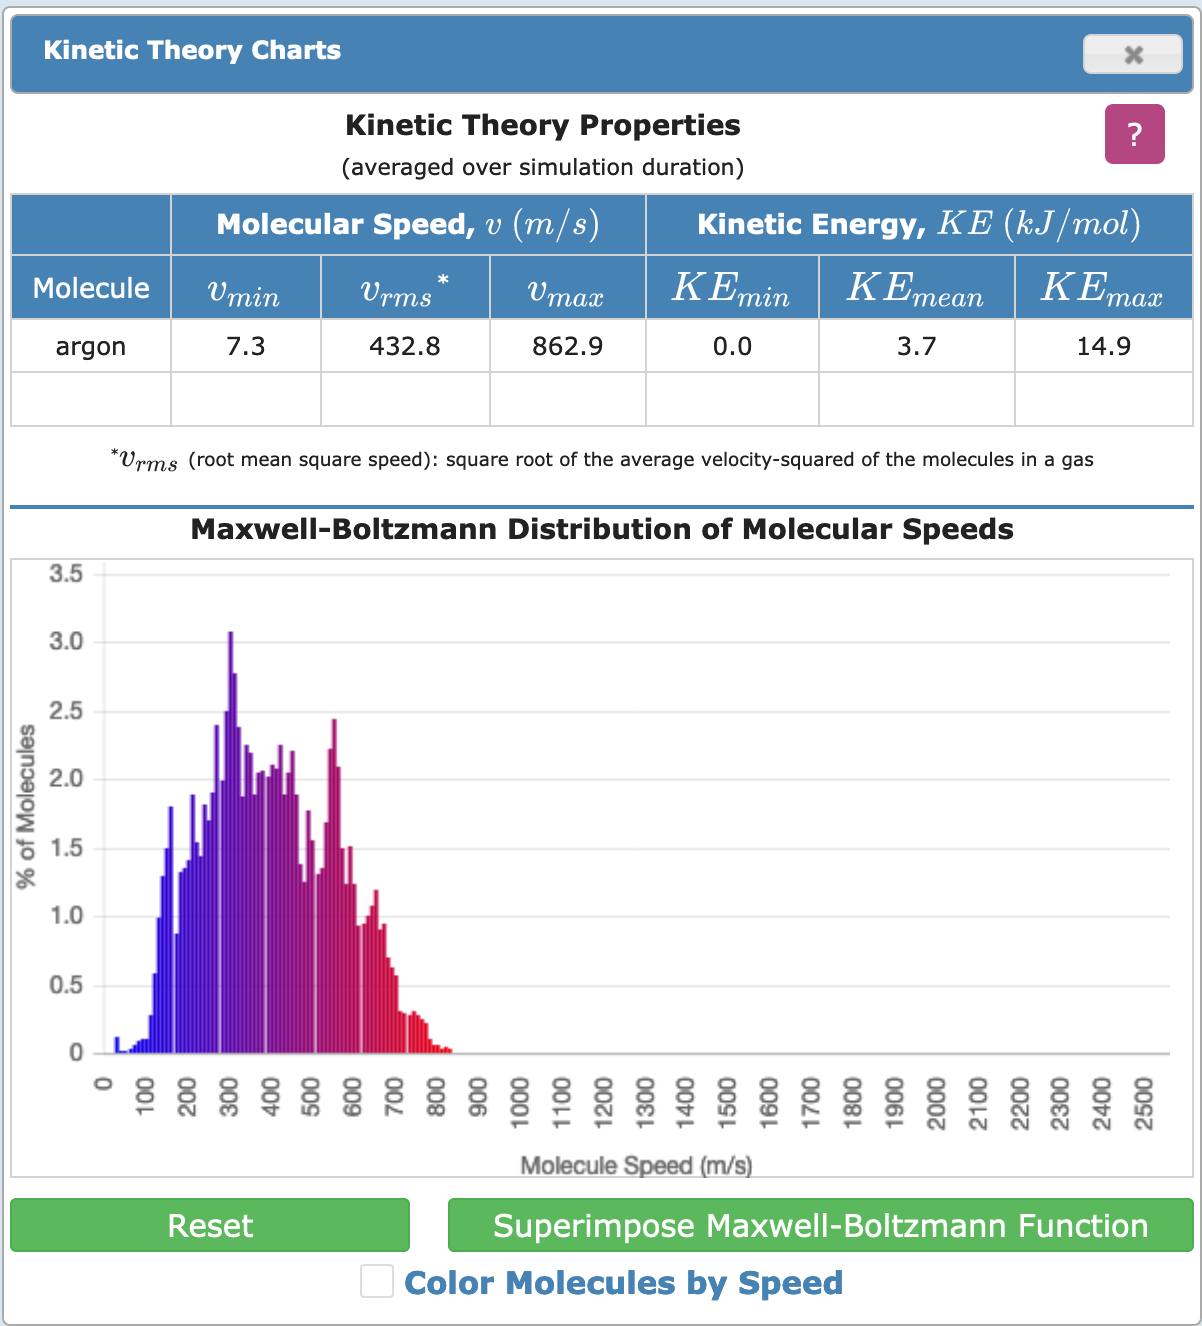
This opens up a graph that shows the speeds (actually, kinetic energy) of the atoms. Yours would be empty initially. Return to Simulation and allow the simulation to run, and observe the distribution that is formed. Does it look like the following? If not, why not?
# Extended Explorations
Here are some suggestions for further exploring the kinetic energy---multiple particles display. Use only a single type of particle. You may need the simulation to run for longer periods.
- Are the kinetic energies distributed symmetrically around a mean?
- Is there a mathematical relationship between temperature and the mean?
- Try the simulation using water as the particle. Observe the additional rotational motion available.
- Lower the temperature. Does the system behave equally at every temperature?
# Calculate the uncertainty from repeated measurements
When repeated measurements are made, you naturally (?) end up recording multiple values:

When a larger number of measurements is made, you may be able to plot a histogram that looks like the following:
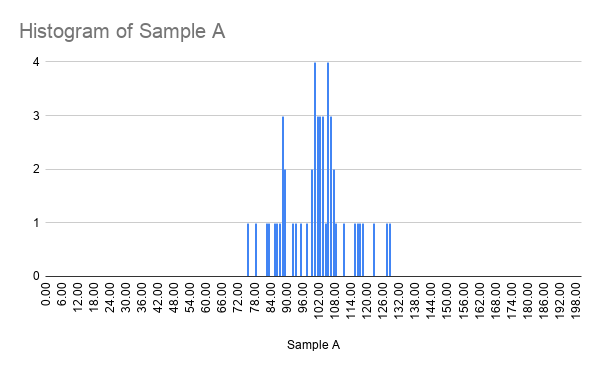
Which you would have seen from the pendulum period measurements from before.
You have learnt that you could designed a range of values using uncertainties. But how do you convert multiple values into an uncertainty of the form X ± U?
You do this in two steps. The first is to calculate the mean X; this would be the value before the uncertainty symbol (±). For the above, this would be
$$X = \dfrac{105.7 + 115.3 + 116.6 + 102.0 + 102.5 + 127.6 + 128.2}{7}$$For this course, we accept two different ways of determining the uncertainty:
- As a standard deviation, and
- Relating to the maximum and minimum values
Both of these would be woeful simplifications if you are a statistician --- but hey, we aren't, so this is good enough (for now).
# As Standard Deviation
Most measurements, when collected in large enough numbers, result in a symmetric bell curve. This is called a normal distribution or a Gaussian distribution. The next graph shows four different normal distributions: the blue, red, and yellow would have the same average but different "bell width".
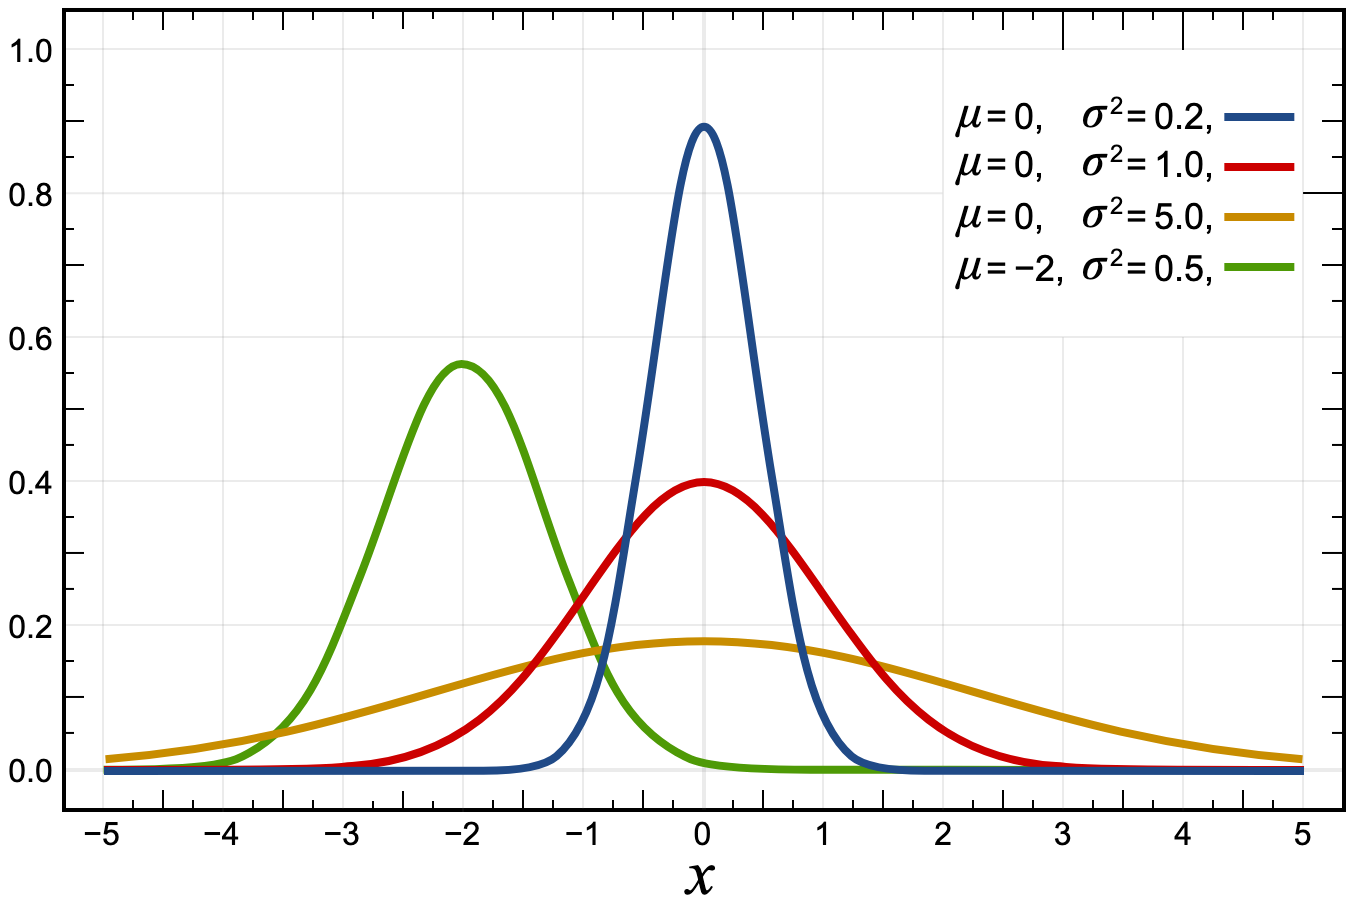
When there is a normal distribution, statisticians would use a standard deviation to describe the width of the bell.
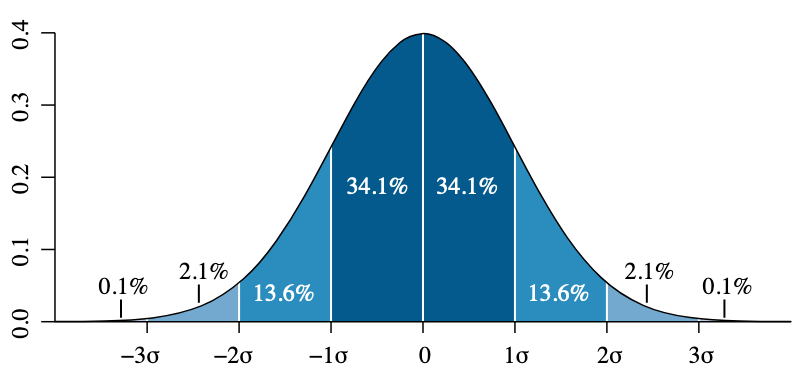
The lower the standard deviation, the narrower the bell would be. In other words, the lower the uncertainty.
Mathematically the standard deviation is calculated as:
$$s = \sqrt{\frac{1}{N-1}\sum_{i=1}^N \left(x_i - \bar{x}\right)^2}$$...but for IB chemistry we will NOT be calculating this by hand. Instead, we will simply use the graphical calculator or the spreadsheet function STDEV(), placing the values for which you want to calculate the standard deviation inside the bracket. This value would be what we quote as the uncertainty.
# Relating to the maximum and minimum values
What happens if we do not have a spreadsheet available and don't know how to do the standard deviation on a calculator? Well, we would then take a further simplification by estimating the uncertainty U as
$$U = \dfrac{(max - min)}{2\sqrt{n}}$$where max and min are the maximum and minimum measurements, and n the number of times a measurement have been made.
Using our previous set of numbers as an example:
The uncertainty would be estimated as
$$U = \dfrac{(128.2 - 102.0)}{2\sqrt{7}} = $$# Your turn
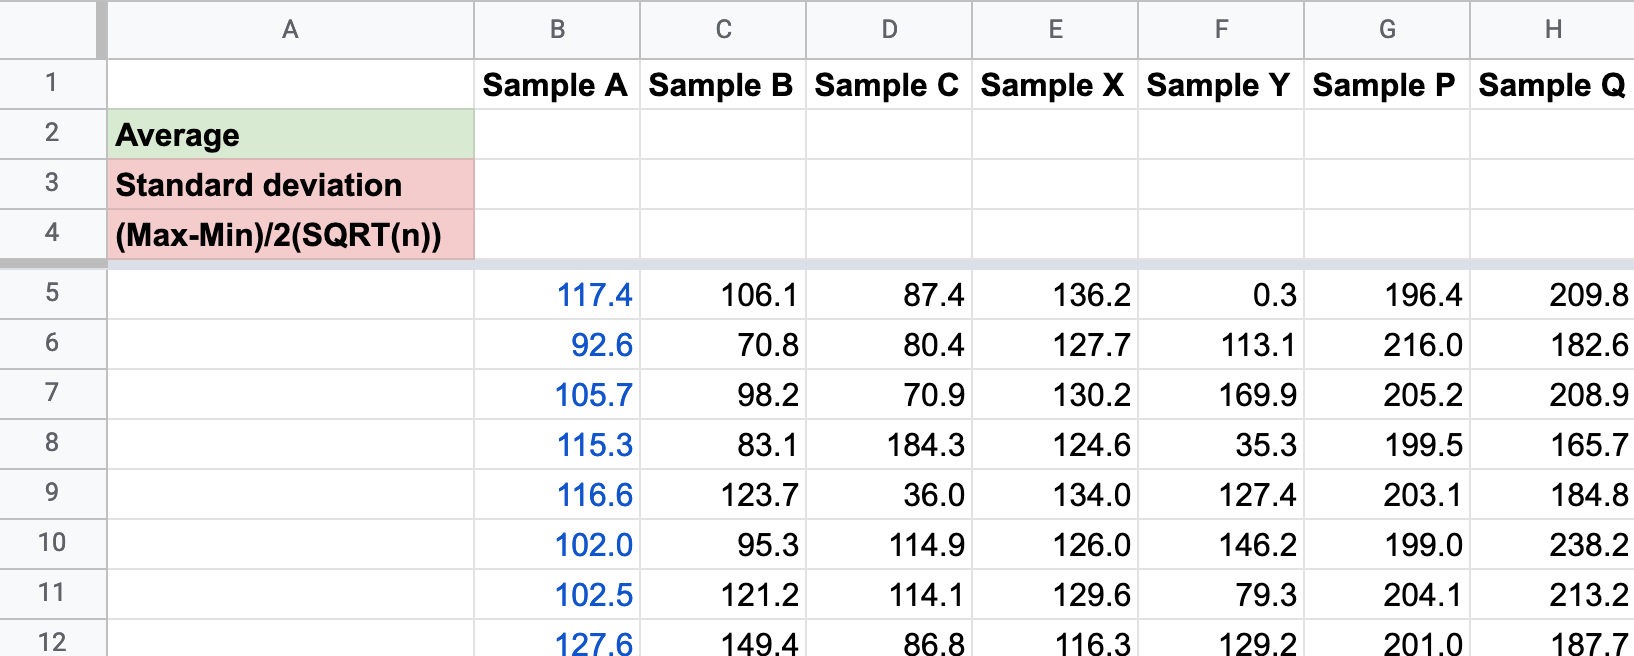
I have prepared several different data samples in this spreadsheet. Make a copy for your own use (File -> Make a Copy. Remember to put it in an appropriate folder!) This tests your ability to manipulate data in spreadsheets.
Spreadsheet skills
If you skipped the spreadsheet tutorials and homework from earlier weeks, you will probably be stuck. Go back and make sure you can do everything from those tutorials first.
- Plot a histogram for Sample B. (Sample A has been done for you as an example.)
- Plot a histogram that contains all samples. This will allow you to compare them visually. (Hover over the graph to highlight it against the others.)
- Calculate the mean in cells
B2-H2 - Calculate the standard deviation in
B3-H3using theSTDEV()function. - Construct a formula in
B4that would calculate the uncertainty using the Max/Min method. Consider using parenthesis so you are clear about the logic of the formula. You may need to ask Professor Google for how to find the maximum, minimum, and number of items in a list. - Adjust the uncertainties to somewhat meaningful number of significant figures.
- Compare and contrast the two methods. Are they equivalent? What does that say about uncertainty?
These are skills you will use for writing up the lab report.
Solutions
Check the solution tab for a completed attempt.
Integrating the session
Is it possible to describe the distribution of molecular speeds / kinetic energies using what you learnt in the uncertainty section? Why or why not? Think about the assumptions made in our uncertainty calculations, and examine the energy distributions from AtomSmith carefully. You may need an extended simulation.